
Fiscal Sponsor Facts and Stats
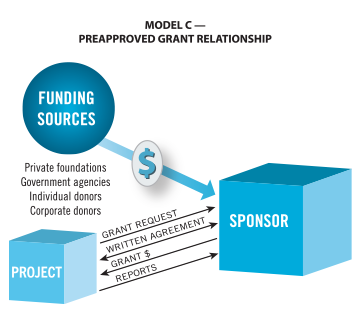
63% (237) of the sponsors in the Directory practice Model C, the preapproved
grant relationship
The 376 sponsors profiled on the Fiscal Sponsor Directory joined after answering a survey about their experience, eligibility requirements, fee structure, services and philosophy — enough information that prospective projects can get a feel for which fiscal sponsors might make a good fit for them.
The Directory, launched in November 2008, has grown to be the largest database of essential information about individual fiscal sponsors. It includes most major players and an increasing number of startup sponsors.
These sponsors operate in 40 states and the District of Columbia, Puerto Rico and Canada. California has the most, 114, almost a third of the total.
Public Health Solutions is the most experienced fiscal sponsor in the Directory — since 1957 — and sponsors three projects now. TSNE MissionWorks started two years later and sponsors 47 projects today.
Fractured Atlas in New York City is the largest fiscal sponsor with 4,000 projects. It operates only online and practices only Model C fiscal sponsorship.
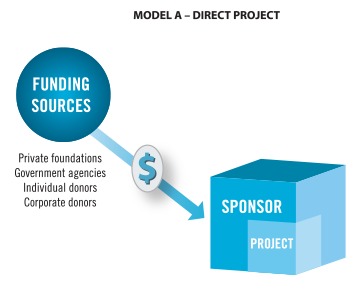
Model A, the direct project, is practiced by 174 sponsors listed in the Directory.
GROWTH: Mirrors the rise of nonprofits
Before the 1950s, only 152,000 501(c)(3)s were operating in the United States. The pace picked up in the 1970s and ’80s, adding roughly 190,000 new nonprofits in each decade. But numbers of brand-new nonprofits almost doubled, to 372,000, in the 1990s. The U.S. had an estimated 2 million nonprofits in 2021, and, according to the IRS, there were 1.8 million 501(c)(3) exempt organizations as of February 2023.
Fiscal sponsorship, on a much smaller scale, has followed the nonprofit growth trajectory. Starting in the late 1960s and into the 1970s — when community programs began to soar as the free-services-for-all concept took hold in California and spread throughout the nation — the need for cost-efficient financial management grew, and the business model gained currency.
New fiscal sponsors jumped in the 1990s. That’s when 51 of the sponsors in this Directory took on their first project. The pace of new fiscal sponsors has accelerated, with 268 Directory participants, or 71%, forming since 2000, a percentage that has been rising as the Directory continues to add fiscal sponsors.
SCOPE: 20,566 projects
Fiscal sponsorship is increasing throughout the United States, a fact that is reflected in the Directory. In the last two years (April 2022 through March 2024), 55 sponsors joined this resource, and dozens of sponsors already profiled reported sizeable jumps in their number of projects.
Though the numbers of fiscal sponsors and the projects they host are minuscule compared with the vastness of the nonprofit sector, fiscal sponsors are an important factor in the increasing quality of nonprofit management, a trend widely acknowledged as awareness of fiscal sponsorship’s benefits spreads throughout the sector.
The Directory’s 376 fiscal sponsors are home to 20,566 projects. A fifth of these are housed at Fractured Atlas, but many sponsors’ numbers are modest. More than a third (34%) of the agencies sponsor up to 5 projects, 12% sponsor 6-10, 19% sponsor 11-25, and 25% sponsor 26-100. Only 9% sponsor more than 100 projects, but these 33 organizations collectively sponsor 13,486 projects, 66% of all the projects represented in the Directory.
A hidden efficiency for nonprofit board development is suggested by the projects-to-sponsor ratio, which is more than 50 to 1. The 20,566 projects under their fiscal sponsors’ board of directors don’t need a board of their own to operate, which takes pressure off the pool of volunteer professionals across the country. A truism of community service is that many board members wear multiple nonprofit hats. If each of the 20,566 projects had to have its own 10-member board of directors, approximately 200,000 civic-minded people in communities across the country would have to stretch themselves ever thinner.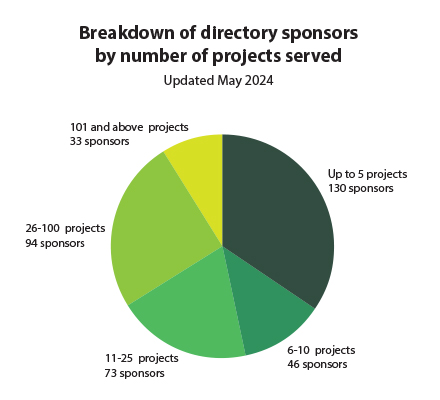
ELIGIBILITY: Aligned mission and geography are key
Sponsors overwhelmingly — 87% — say “aligned mission/values” is their chief criterion for accepting a new project. The second most-cited eligibility criterion is “geographic,” with 43% of the sponsors requiring their projects to operate nearby, in the same metropolitan area, county, state or region.
PROJECT CATEGORIES: Arts is tops, new ones emerging
Among the project categories that sponsors are willing to take on, arts and culture, hands-down, is the most popular: 273 sponsors (73%). Education is the next largest category of service with 226, followed closely by youth development and children, youth and families at 206.
In the last four years, sponsors joining the Directory have been adding project categories to those listed on the original join form: LGBTQ, veterans, homelessness and open space/parks. The numbers have increased so much, we’ve added these four categories to the join form, a reflection of changing times and needs in our communities.
FEES: 5%-10% is most common
Almost every fiscal sponsor says it charges a percentage of project revenues (96%), and, of those, almost half have flat charges ranging from 5% to 10%. Another half have sliding-scale charges, usually depending on a project’s revenues and needed services, and many of those also range from 5% to 10%. Fifty-five sponsors will charge up to 15% or more, usually to handle government-funded projects, which can require adhering to higher federal audit standards. What mostly accounts for the disparity is the range of services a sponsor provides.
SERVICES: Spectrum of assistance
Attorney Gregory Colvin’s Fiscal Sponsorship: 6 Ways To Do It Right, first published in 1993 with an updated edition in 2005, a Kindle edition in 2015 and a much-expanded 3rd edition in 2019, is the most significant publication in the field. It changed the nomenclature of the field — from “fiscal agent” to “fiscal sponsor” — helping the culture of fiscal sponsorship evolve and professionalizing the management model from the days, decades ago, when the relationship was called “a trap for the unwary” funder.
Among the sponsors in the Directory, 63% or 237 practice Model C, the preapproved grant relationship. The second most popular scenario, Model A, the direct project, is practiced by 174 sponsors, 46%. Sixty-one sponsors, 16%, practice both.
The basic service all fiscal sponsors offer their projects is the sharing of their 501(c)(3) charitable status, ensuring donors’ gifts and grants are tax-deductible.
Almost three-quarters of sponsors also provide bookkeeping/accounting and bill paying services. More than a third handle their projects’ payroll, and half provide organizational development and tax reporting. The larger, more experienced sponsors tend to offer a spectrum of financial services — all of the above, plus they usually handle insurance and auditing. This explains why experienced sponsors’ fees are on the higher side — more services, more staff time required.
DATA UPDATES
These highlights from the fiscal sponsors in the Directory were updated in May 2024.